Flat-Rate AI Seats Hide Per-Developer Usage. Here's How I Metered Claude Code and Codex Anyway.
I wanted a single number on a dashboard: how hard is each developer on my team actually leaning on Claude Code and Codex? I am not trying to police anyone. I want to know whether the tools are landing, where adoption is thin, and roughly what the intensity is across people and models.
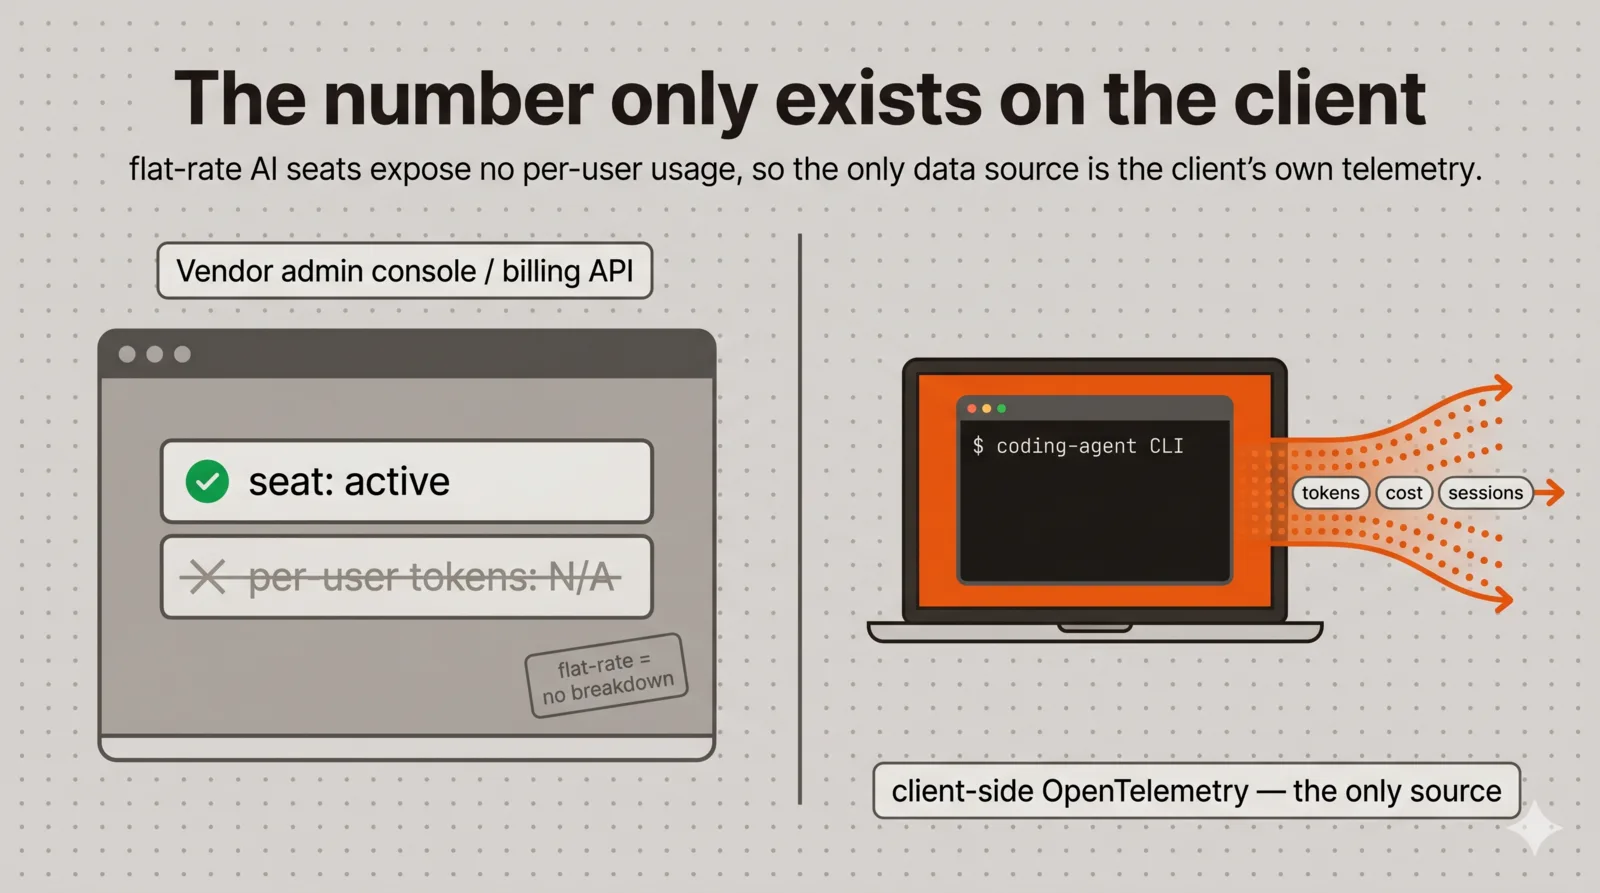
It turns out that number does not exist anywhere you can ask for it. We pay for Claude Code on flat-rate Business seats and Codex through ChatGPT subscriptions. Both vendors will happily tell you that a seat is active in their admin console. Neither exposes per-user token counts for a subscription seat; those numbers only exist behind the metered API billing, which is a different product than the flat-rate coding plans. So if your team is on subscriptions, the vendor side of the house is a dead end.
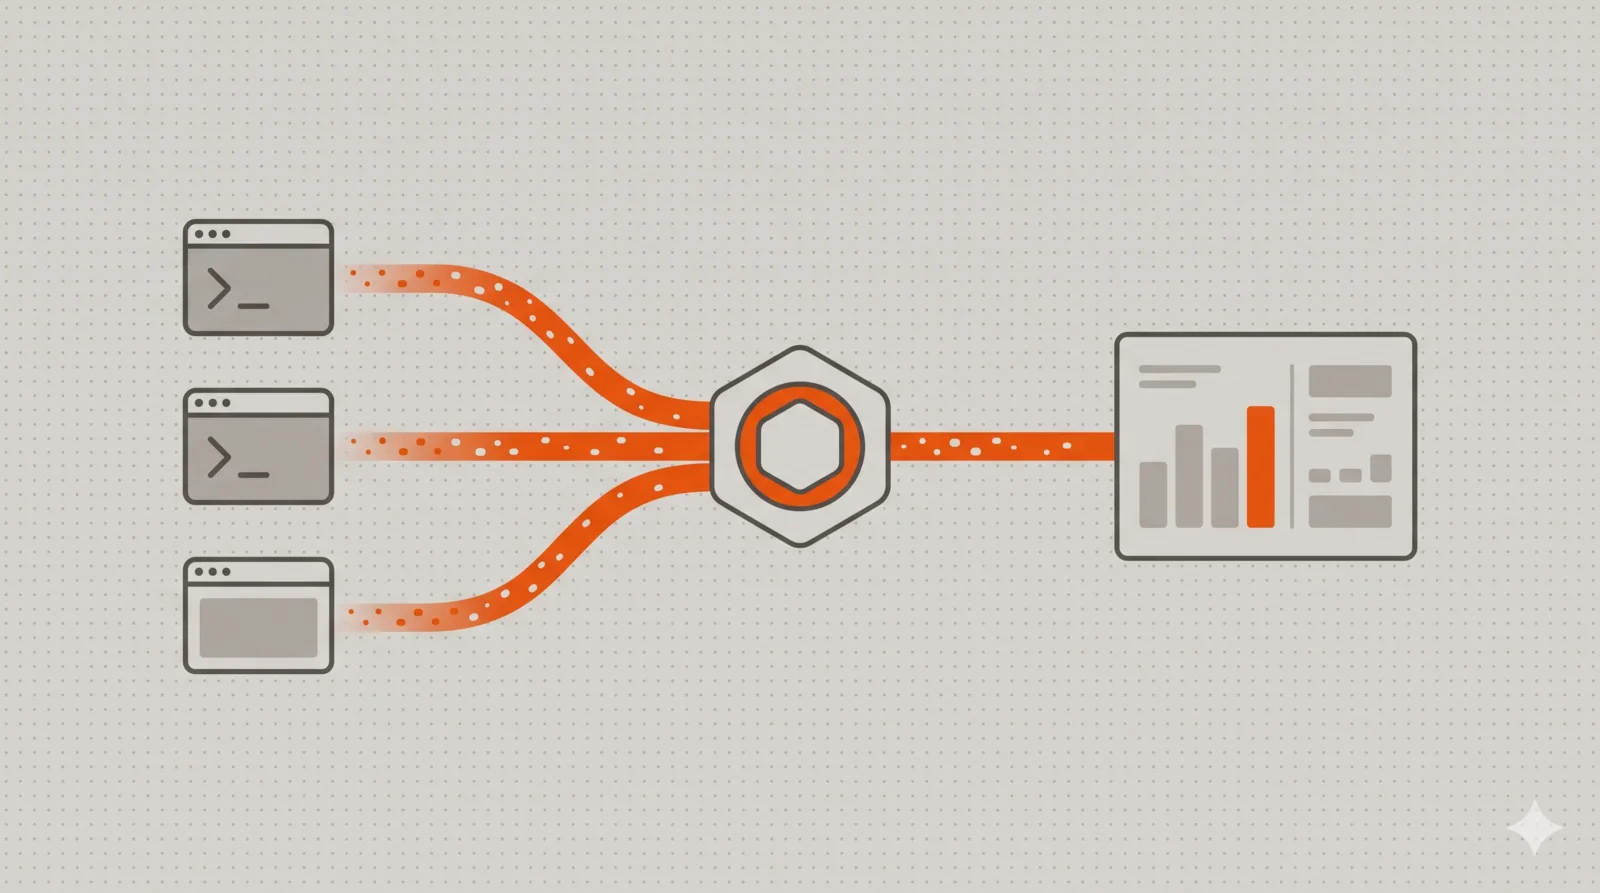
The way in is that both CLIs instrument themselves with OpenTelemetry and will export tokens, cost estimates, session counts and timings to any endpoint you point them at. That export is the entire source of truth here. What I built on top of it is a single Grafana dashboard, and what surprised me is that it turned into a strategic instrument rather than just an adoption tracker. So this post comes in two halves. The first is the case for doing it at all, which is the part to read if you are deciding whether your org needs this. The second is the build, including the four ways the data silently disappeared between “the door is open” and “a number appears.”
Why you can’t just ask for this number
It’s worth being precise about why there’s no shortcut, because I went looking for one.
Anthropic’s Usage and Cost APIs cover API consumption: usage tied to keys rather than to seats. A flat-rate Claude Code seat doesn’t show up there with per-user token granularity. Same story for Codex on a ChatGPT plan. The admin consoles give you an activity view of who logged in and roughly when, never a figure like “user X burned 4.1M tokens this week.”
The tool I kept seeing recommended was ccusage, which parses Claude Code’s local JSONL session files into a usage report. It’s good, but it reads the same data the native OTEL export reads, only locally, so to centralize it across a team you’d be running a per-machine cron to ship a parsed report somewhere. The native OpenTelemetry export does the shipping for you, live, in a format a metrics backend already understands. Once I saw that, ccusage stopped making sense for the team question, though it’s still fine for “what did my own laptop do today.”
So the approach is client-side telemetry. Both CLIs emit it, and I just needed somewhere to catch it.
One scope note up front, because it surprised people when I explained it: this is not just the CLIs. The claude.ai web and desktop apps export the same kind of telemetry, so they feed the same dashboard and the non-technical half of the org shows up too. What’s worth watching there isn’t raw chat. It’s the agentic features, Office agents and Cowork, which is where our non-developers actually do work worth measuring. Most of them only generate anything interesting through Cowork; someone going back and forth with the chat in a browser tab isn’t a signal I care about, and the dashboard doesn’t pretend it is. The only genuinely uncountable usage is work done through a personal account that isn’t carrying the org’s telemetry settings.
What the dashboard tells you
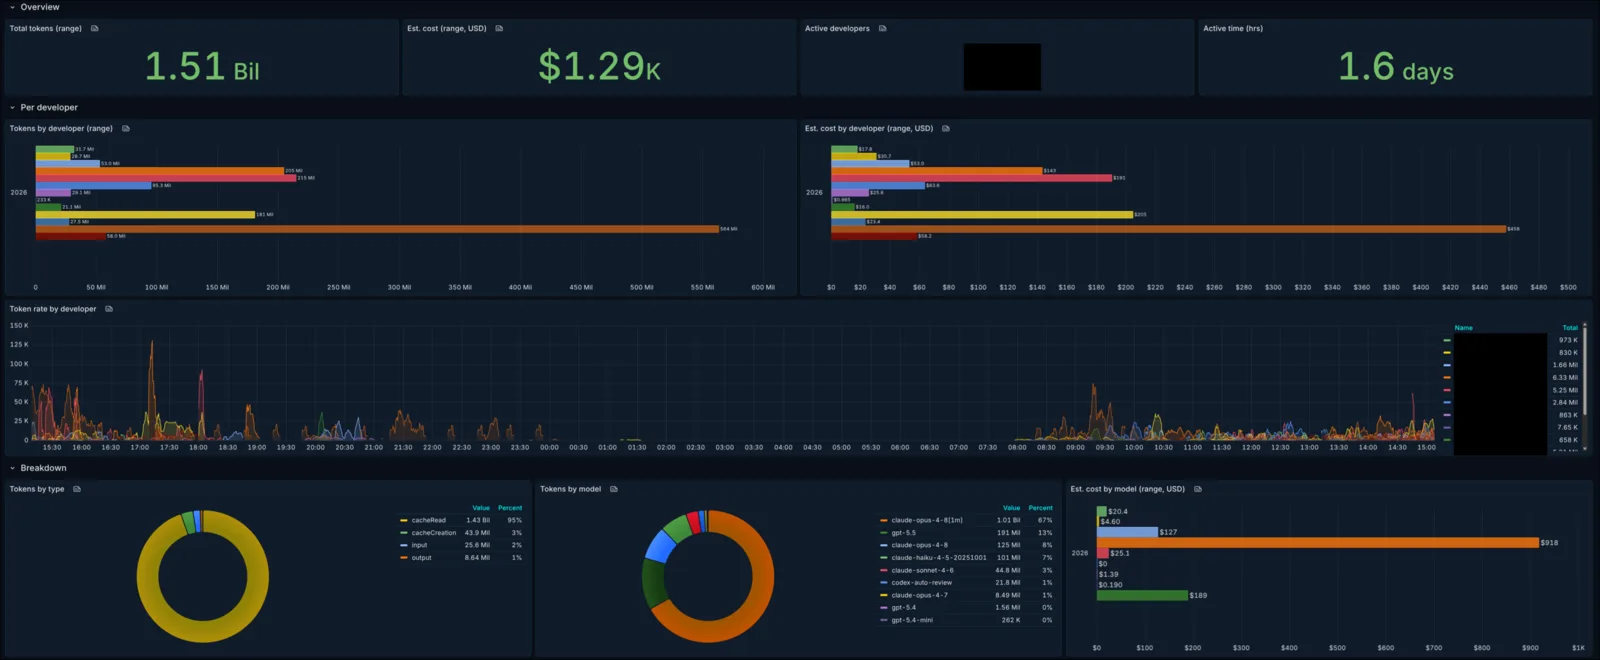
Point every client at the same place and the result is a single dashboard that covers the whole org at once: developers in the terminal, developers in their IDE, and non-developers in Cowork. Claude Code, Codex, and the claude.ai apps all report into the same handful of metrics, which the build section explains how to wire. It’s templated on a $user variable (multi-select, defaulting to all) and a $datasource, and it’s organized in three rows:
- Overview: total tokens, estimated cost, active developers, and active hours over the selected range.
- Per developer: tokens and cost as bar charts ranked by person, plus a token-rate timeseries that shows when people are working rather than just totals.
- Breakdown: tokens by type and by model as pie charts, cost by model, and a developer × type table for the full grid.
Every panel is a variation on a single query, increase(claude_code_token_usage{user_email=~"$user"}[$__range]). The active-developers stat is the one I check first; count(count by (user_email)(increase(claude_code_token_usage[$__range]) > 0)) answers “how many people touched an AI tool this week,” which turned out to be the adoption question I actually cared about, more than any token total.
Why I track a cost we don’t actually pay
One panel on that dashboard is worth dwelling on, because it’s the easiest to dismiss and it’s actually the most strategically important thing here: the estimated cost. We pay for everything with flat-rate subscriptions, so the cost panel doesn’t reflect a bill we receive. It applies the vendors’ public per-model API prices to our actual token counts, which makes it a live answer to a different question: what would this usage cost if we were billed by the token instead of by the seat? Today it’s useful as a relative measure, showing who’s running hot and which models dominate, and that alone earns the panel its place. But the reason I really keep it is that it’s a number we don’t pay yet, and I don’t think it stays that way.
The whole industry is drifting from flat-rate to metered, in public. GitHub’s own announcement is titled, with no ambiguity, “GitHub Copilot is moving to usage-based billing”: through 2025 they bolted “premium requests” onto the flat fee, and in 2026 they replaced that with token-metered “AI Credits,” so the monthly fee is now a prepaid bucket that drains at each model’s API rate. Cursor did the same a year earlier, swapping fixed request quotas for dollar-denominated usage pools tied to model cost, and it ate a wave of backlash and refunds when heavy agentic users watched their effective spend jump. Even the tools we use are inching over: OpenAI repriced Codex in April 2026 to meter by actual tokens rather than per-message estimates (the flat plan stayed, but the accounting is now per-token), and Anthropic announced a credit pool that would bill non-interactive agent usage at API rates, then paused it days before launch. Interactive Claude Code, chat, and Cowork are still flat-rate as I write this.
So I’m not predicting the subscription vanishes tomorrow, and that part is my opinion rather than anyone’s announced plan. What I am saying is that the direction of travel is one-way, every vendor is testing the water, and “flat-rate coding seats” is starting to look more like an introductory price than a permanent arrangement. The day a metered bill arrives, for us or for the next tool we adopt, the estimate panel stops being a curiosity and becomes a forecast I already have a year of history on, split by developer and by model. That’s the cheapest insurance I know: measuring your usage in the units a future bill would use is work you do once, quietly, before you need it.
One honest caveat about that estimate: it overstates a real metered bill, by a lot. It multiplies list prices by raw token counts and ignores prompt caching, and agentic coding is the single most cache-friendly workload there is, re-sending the same system prompt, repo files, and tool definitions every turn. Anthropic’s API discounts cached input by around 90%, so an actual bill would be a fraction of the panel’s number. The cost panel is best read as a ceiling on the real spend. Closing the gap is a future enhancement: price cached and uncached input separately, since the build already keeps a per-type breakdown.
The same number unlocks a bigger question: at what point do you stop renting and buy the hardware? If the bill is metered and large, buying a server and running an open-weight model is genuinely on the table, and you cannot reason about it without your real sustained token volume and cost, which is exactly what the dashboard measures. The rest of the math is sobering, though. The best open-weight coding models have closed most of the benchmark gap. GLM-5.2, a 744B-parameter (40B active) mixture-of-experts model, scores 62.1% on SWE-Bench Pro against Claude Opus 4.8’s 69.2%, and Qwen3-Coder and DeepSeek are in the same neighborhood. But being close on benchmarks is not the same as being good enough on the long-horizon agentic work that burns most of your tokens, where frontier models still pull away. And the hardware is not a side quest: running GLM-5.2 well means holding 220 to 480GB of weights in fast memory, which is a 256GB unified-memory box at the small end and a multi-GPU server (anywhere from $60k to well over $250k) at the end that actually serves a team, and even then one box realistically serves only a handful of concurrent agent sessions rather than the whole org.
Then there’s the part token-price math always forgets: self-hosting throws away the cache discount. That ~90% you save on cached input at the API is gone when you own the GPUs, because you pay full compute for every re-sent token. Add ops time, electricity, and the fact that frontier models improve faster than a depreciating GPU box can amortize, and the break-even lands far higher than the sticker comparison suggests, realistically into the hundreds of millions of tokens a month before it pencils out against frontier APIs, and higher still against cheap open-model API providers. For almost every team, including ours, the honest answer today is to keep paying. But that’s the whole point of measuring: I don’t want to guess the answer to “should we self-host,” I want to run the real numbers, and re-run them the day the pricing model flips or an open model crosses from benchmark-close to good enough. The board that tells me who’s adopting the tools is the same one that will tell me, with numbers instead of vibes, when build finally beats buy. For now it says buy, and I’ll know when that changes.
That’s the case for building this. If you are deciding whether your org needs it, you now have what you came for: a live picture of who is leaning on AI and how hard, and a cost figure that becomes a real forecast the moment pricing changes. The rest of this post is the build, wire by wire, for whoever ends up standing it up, and it is also the story of the four ways the data silently disappeared before a single number reached that dashboard.
Where the data goes
The shape is the standard OTLP story: each CLI is an OpenTelemetry client, it pushes to a collector, and the collector writes to a metrics/logs/traces backend. We already run Grafana Alloy in front of an LGTM stack (Loki, Grafana, Tempo, Mimir) for our own services, so the collector and backend already existed.
The one design decision worth stealing is to keep this away from your production collector. Our prod Alloy is gRPC-only, customer-facing, and tags everything as mobile-app traffic, so pushing developer-laptop telemetry through it would have meant pipeline surgery and polluted attribution. Our observability cluster’s Alloy already had both grpc {} and http {} receivers and wrote straight to the in-cluster Mimir/Loki/Tempo, so the entire job came down to adding a public front door and getting attribution right, with no new pipeline.
Dev laptops (Claude Code / Codex, native OTEL)
        │  OTLP + Basic auth, over TLS
        ▼
otel.example.com         (HTTPS, behind auth)
        │  reject if unauthenticated
        ▼
Alloy receiver  ──►  Mimir (metrics) / Loki (logs) / Tempo (traces)
The front door
Alloy’s OTLP/HTTP receiver listens on :4318. The only thing that really matters about exposing it is that it’s a write endpoint facing the public internet, so it has to be authenticated. An open OTLP ingest lets anyone pump garbage into your metrics backend. How you lock it down is whatever your ingress already does: I terminate TLS and enforce HTTP basic auth at the edge, but a bearer-token header, mTLS, or an IP allowlist would all do the job just as well.
I used basic auth and treated the credential as deliberately low-value. It guards a write-only endpoint, so you can POST telemetry but can’t read anything back, and attribution doesn’t come from the auth user anyway; it comes from the OTel resource attributes inside the payload, which I’ll get to below. One shared user:password for the whole team is fine, because the header is there only to keep the endpoint from being wide open. And, obviously, don’t commit the real Authorization: Basic header into a public repo or, say, a blog post. Every header in this post is a placeholder.
Configuring the clients
For Claude Code, the export is driven entirely by environment variables. The thing to watch is that the variable names are the generic OTel ones (OTEL_EXPORTER_OTLP_ENDPOINT, OTEL_METRICS_EXPORTER, and so on). If you export those from your ~/.zshrc, you’ll silently redirect every OpenTelemetry-aware tool on your machine at your telemetry door, which is not what you want. Scope them to the CLI by putting them in Claude Code’s own settings file, which applies to both terminal and IDE launches:
// ~/.claude/settings.json  (user-level) or .claude/settings.json (per-repo)
{
  "env": {
    "CLAUDE_CODE_ENABLE_TELEMETRY": "1",
    "OTEL_METRICS_EXPORTER": "otlp",
    "OTEL_LOGS_EXPORTER": "otlp",
    "OTEL_EXPORTER_OTLP_PROTOCOL": "http/protobuf",
    "OTEL_EXPORTER_OTLP_ENDPOINT": "https://otel.example.com",
    "OTEL_EXPORTER_OTLP_HEADERS": "Authorization=Basic <base64(user:password)>",
    "OTEL_METRIC_EXPORT_INTERVAL": "60000"
  }
}
If you want this non-overridable across a fleet, so a developer can’t quietly turn it off, Claude Code also reads a managed settings file (/Library/Application Support/ClaudeCode/managed-settings.json on macOS, /etc/claude-code/managed-settings.json on Linux) with the same env block. I went with opt-in user settings instead, because the goal was adoption insight rather than surveillance, and a tool people feel spied on by is a tool people stop using. Your call; the mechanism supports both.
On privacy. Skipping message content was a deliberate decision. Prompt and response content is never exported; the metrics are token counts, cost, timings, model, and which hooks and MCPs ran, and nothing else. We could capture the actual messages, since Claude Code ships prompt content if you set OTEL_LOG_USER_PROMPTS=1 and Codex has its own log_user_prompt switch, and we intentionally leave both off. That choice matters more once you remember the pipeline also covers non-technical staff running Cowork: being able to tell the whole org, truthfully, that this counts your tokens and never your words is worth more than any panel on the dashboard.
At this point the door was green by every external check: DNS resolving, basic auth returning 200 on a good credential and 401 on a bad one, a valid Let’s Encrypt cert, and Alloy’s own internal metrics confirming it had accepted metric points with zero refused. And yet not a single metric was landing in Mimir.
The four ways the pipeline silently ate my data
This is the part that took the longest, because every failure had the same shape: a 2xx somewhere early that made it look like the data landed, while it was actually being dropped one hop later. If you wire up OTLP into a Prometheus-flavored backend yourself, you will probably hit at least one of these.
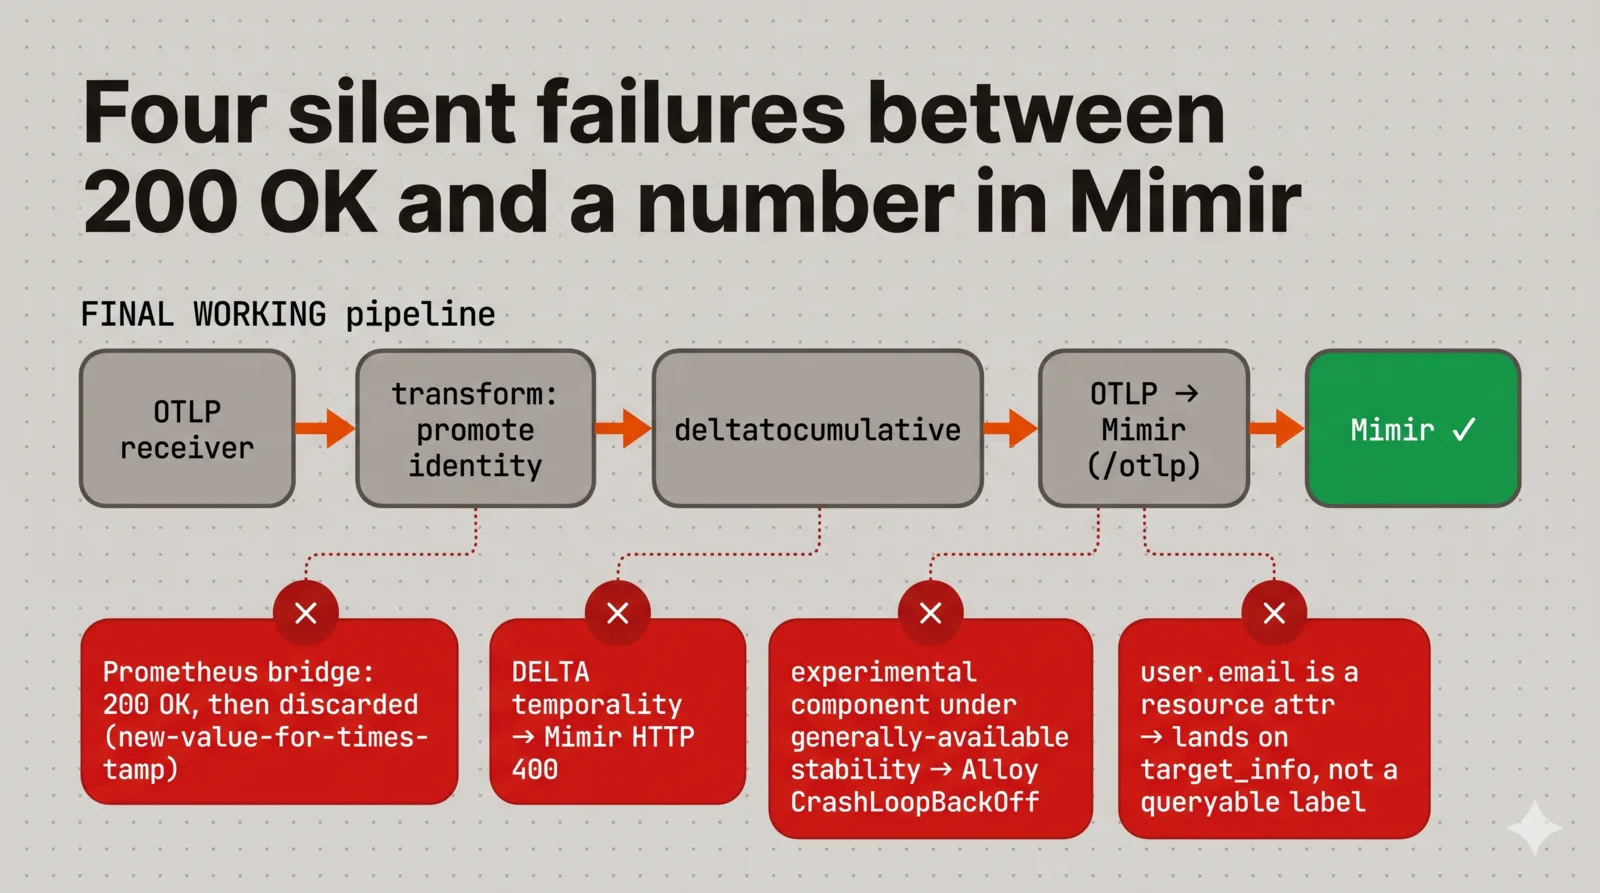
1. The Prometheus bridge that accepts and discards
My first Alloy config took the OTLP metrics, ran them through otelcol.exporter.prometheus, and handed them to prometheus.remote_write pointed at Mimir. This is the “obvious” path and it’s in a lot of examples. Alloy’s own logs said it was writing samples with zero failures. Mimir returned 200.
The samples never appeared, though. The OTLP-to-Prometheus bridge produced samples that, after relabeling, collided on identical timestamps, and Mimir’s ingester rejects those server-side as new-value-for-timestamp, after it has already acknowledged the write at the HTTP layer. The client sees success while the server quietly discards. The only place the truth shows up is an internal Mimir counter:
sum by (reason) (rate(cortex_discarded_samples_total[5m]))If you see reason="new-value-for-timestamp" climbing while your client reports clean writes, this is you. The fix is to stop bridging to Prometheus remote-write at all and use Mimir’s native OTLP ingest endpoint (/otlp/v1/metrics), which understands OTLP cumulative temporality and timestamps natively:
otelcol.exporter.otlphttp "mimir" {
  client {
    // otlphttp appends /v1/metrics  ->  http://.../otlp/v1/metrics
    endpoint = "http://lgtm-mimir-nginx.monitoring.svc.cluster.local.:80/otlp"
  }
}
2. Delta vs cumulative: a 400 hiding under the previous bug
Native OTLP ingest got me a different error, which counts as progress. Now Alloy’s exporter logged send_failed equal to received, and Mimir returned a hard HTTP 400:
otlp parse error: invalid temporality and type combination
for metric "claude_code.token.usage"
This is the true root cause that the bridge bug was sitting on top of. Claude Code exports its sums with DELTA temporality, and Mimir’s OTLP ingest only accepts CUMULATIVE. A delta sum is “47 tokens since the last export”; a cumulative sum is “12,431 tokens total so far.” Mimir wants the latter and refuses the former outright.
You can fix this per-client by setting OTEL_EXPORTER_OTLP_METRICS_TEMPORALITY_PREFERENCE=cumulative in everyone’s settings, but that’s a fleet-wide config you have to keep enforcing on every machine and every CLI version. I’d rather fix it once, server-side, where no client can get it wrong:
// Claude exports DELTA sums; Mimir OTLP ingest only takes CUMULATIVE.
// Convert here, once, for every client regardless of SDK/version.
// State is in-memory, so a collector restart just looks like a counter reset.
otelcol.processor.deltatocumulative "default" {
  output {
    metrics = [otelcol.exporter.otlphttp.mimir.input]
  }
}
3. The experimental component that crash-looped the collector
Dropping deltatocumulative into the config took the whole Alloy pod into CrashLoopBackOff, and because this is the shared observability collector, that briefly took log and trace ingestion down with it. The error was that deltatocumulative is an experimental-stability component, and the chart was launching Alloy with --stability.level=generally-available, so Alloy refused to even load a config that referenced it.
The fix is one chart value:
alloy:
  stabilityLevel: "experimental"   # -> --stability.level=experimental
The lesson here is broader than the flag. Adding a developer-telemetry experiment to a collector that also carries production observability is not free: a config it rejects doesn’t degrade gracefully, it fails to start, and everything else that collector does goes down with it. If I were doing it again from the start I’d have given this its own Alloy instance and merged it back once stable. It shares now, since it’s stable, but the crash-loop was avoidable.
4. Attribution: your identity is on the wrong part of the payload
With the previous three fixed, real series finally showed up in Mimir, but I couldn’t group them by developer. The user.email was in there, just not as a queryable label.
This is a structural thing about how Mimir maps OTLP, and it’s worth understanding rather than memorizing: OTLP datapoint attributes become series labels, while OTLP resource attributes go onto a separate target_info metric. That split is deliberate and useful, because it’s what keeps unbounded values like session.id from exploding the cardinality of every series. But Claude Code puts the identity fields (user.email, user.id, organization.id) on the resource, so out of the box they land on target_info rather than on the token metric you actually want to sum by (user_email).
So the last piece is a transform that promotes the few identity attributes I want to group by from the resource onto the datapoint, and at the same time drops the high-cardinality values (session.id, request.id) from the metrics path:
otelcol.processor.transform "promote_identity" {
  error_mode = "ignore"
  metric_statements {
    context = "datapoint"
    statements = [
      `set(attributes["user_email"], resource.attributes["user.email"]) where resource.attributes["user.email"] != nil`,
      `set(attributes["user_id"], resource.attributes["user.id"]) where resource.attributes["user.id"] != nil`,
      `set(attributes["organization_id"], resource.attributes["organization.id"]) where resource.attributes["organization.id"] != nil`,
      // unbounded, so drop from metrics (still fine on the logs stream)
      `delete_key(attributes, "session.id")`,
      `delete_key(attributes, "request.id")`,
    ]
  }
}
Now user_email is a first-class label and sum by (user_email) (...) works, while session.id stays bounded on target_info where it can’t hurt anything.
The metric names are not quite what you’d expect
One last detail, because it’s the kind of thing that makes you doubt the whole pipeline works. Mimir’s OTLP ingest does not append Prometheus’s usual _total suffix to counters, so claude_code.token.usage becomes claude_code_token_usage rather than claude_code_token_usage_total. The only _total you’ll see is on metrics where Claude itself put the word in the name, like active_time.total becoming claude_code_active_time_total. If your first PromQL returns nothing, drop the _total you reflexively typed and try again.
increase() and rate() both work correctly on these series, which is the proof that the delta-to-cumulative conversion did its job.
Adding Codex without building a second dashboard
Half the team uses Codex instead of Claude Code. Codex also exports OpenTelemetry, so in principle it feeds the same pipeline, but making it land on the same dashboard took two more pieces.
One door isn’t enough: HTTP for Claude, gRPC for Codex
My first instinct was to reuse the HTTP door for Codex too: one endpoint, one credential, done. It doesn’t work, and the reason is an annoying split in what each tool’s transport actually supports. The capability matrix:
| Source | OTLP/HTTP | OTLP/gRPC |
|---|---|---|
| claude.ai website + desktop app | Yes | No |
| Claude Code CLI | Yes | Yes |
| Codex CLI | Partial | Yes |
Codex technically exports over HTTP, but the data that comes out is odd enough that I wouldn’t call it fully working, which is what the rest of this section explains.
So the obvious question is: if everything speaks HTTP, why not run one HTTP door and be done? Two separate things rule that out.
Claude is effectively HTTP-only for us, by configuration. We set Claude’s telemetry centrally through the claude.ai console, which is how the settings get distributed to the fleet, and that surface only exposes http/protobuf and http/json. There’s no gRPC option there at all, even though the Claude Code CLI binary itself can speak gRPC, and the website and desktop app can’t do gRPC under any configuration. So in practice Claude goes over HTTP, and there’s no knob to change that without giving up the console as the config source.
Codex is effectively gRPC-only for us, by bug. This is the part we lost the most time to. Point Codex at the same single HTTP endpoint and its metrics never land in Mimir; only its logs and events show up. As best I could tell, Codex was shipping the token-usage metrics through the logs path instead of the metrics path, because Codex treats the HTTP endpoint as a literal URL, so when you give it one endpoint, every signal gets POSTed to that exact path. Aim it at …/v1/logs and the metrics go to the logs path and get dropped. I’ll be honest that I never fully pinned down whether the failure was on the send side or the parse side; by the time I’d narrowed it that far, gRPC had already made the question moot.
Because gRPC multiplexes logs, metrics and traces over one connection with no per-signal URL path, there’s no logs-versus-metrics path for Codex to get wrong, and switching Codex to a gRPC door made its metrics appear immediately. You can make Codex work over HTTP, but only by giving it two separate endpoints (/v1/logs and /v1/metrics), each with an explicit protocol = "binary". We never got the single-endpoint HTTP setup to behave, and once gRPC worked there was no reason to keep fighting it.
So we run both transports on the same Alloy: an HTTP door for the whole Claude side (the Claude Code CLI plus the claude.ai web and desktop apps, all console-configured), because that’s all the console offers, and a gRPC door for Codex, because HTTP silently ate its metrics. Neither “HTTP for everything” nor “gRPC for everything” was actually available to us.
Codex points at a second hostname behind the same auth, routed to Alloy’s gRPC receiver on :4317. One detail specific to gRPC matters here: if you terminate TLS at the edge, the route to Alloy has to speak plaintext HTTP/2 (h2c), because TLS is already off by the time the request reaches the backend, and a normal HTTPS backend scheme will fail the handshake.
The Codex client config lives in ~/.codex/config.toml, with two exporters, one for logs/events and one for metrics, both pointed at the gRPC door:
# ~/.codex/config.toml
[otel]
environment = "production"
log_user_prompt = false   # keep prompt text redacted (the default)

[otel.exporter."otlp-grpc"]           # logs / events
endpoint = "https://otel-grpc.example.com"

[otel.metrics_exporter."otlp-grpc"]   # metrics -> token usage -> Mimir
endpoint = "https://otel-grpc.example.com"
And here’s the per-developer rollout cost that Claude Code didn’t have: Codex does not put user.email on the metric resource by default. Each developer has to declare their own identity, which Codex reads from ~/.codex/.env:
# ~/.codex/.env  (per developer; survives app restarts)
OTEL_EXPORTER_OTLP_HEADERS=authorization=Basic%20<base64(user:password)>
OTEL_RESOURCE_ATTRIBUTES=user.email=[email protected],user.id=[email protected],organization.id=yourorg
Once that resource attribute is set, the same promote_identity transform from before picks Codex’s metrics up with no extra work, and user_email lands as a label exactly like Claude’s.
Making Codex look like Claude on the dashboard
The awkward part is that Codex and Claude don’t agree on metric shape. Codex emits a per-turn histogram, codex.turn.token_usage, with a token_type datapoint attribute (input, cached_input, output, reasoning_output, total). Claude emits a typed sum, claude_code.token.usage, with a type label (input, output, cacheRead, cacheCreation). To get both onto the one dashboard from the top of this post, something has to normalize Codex into Claude’s vocabulary.
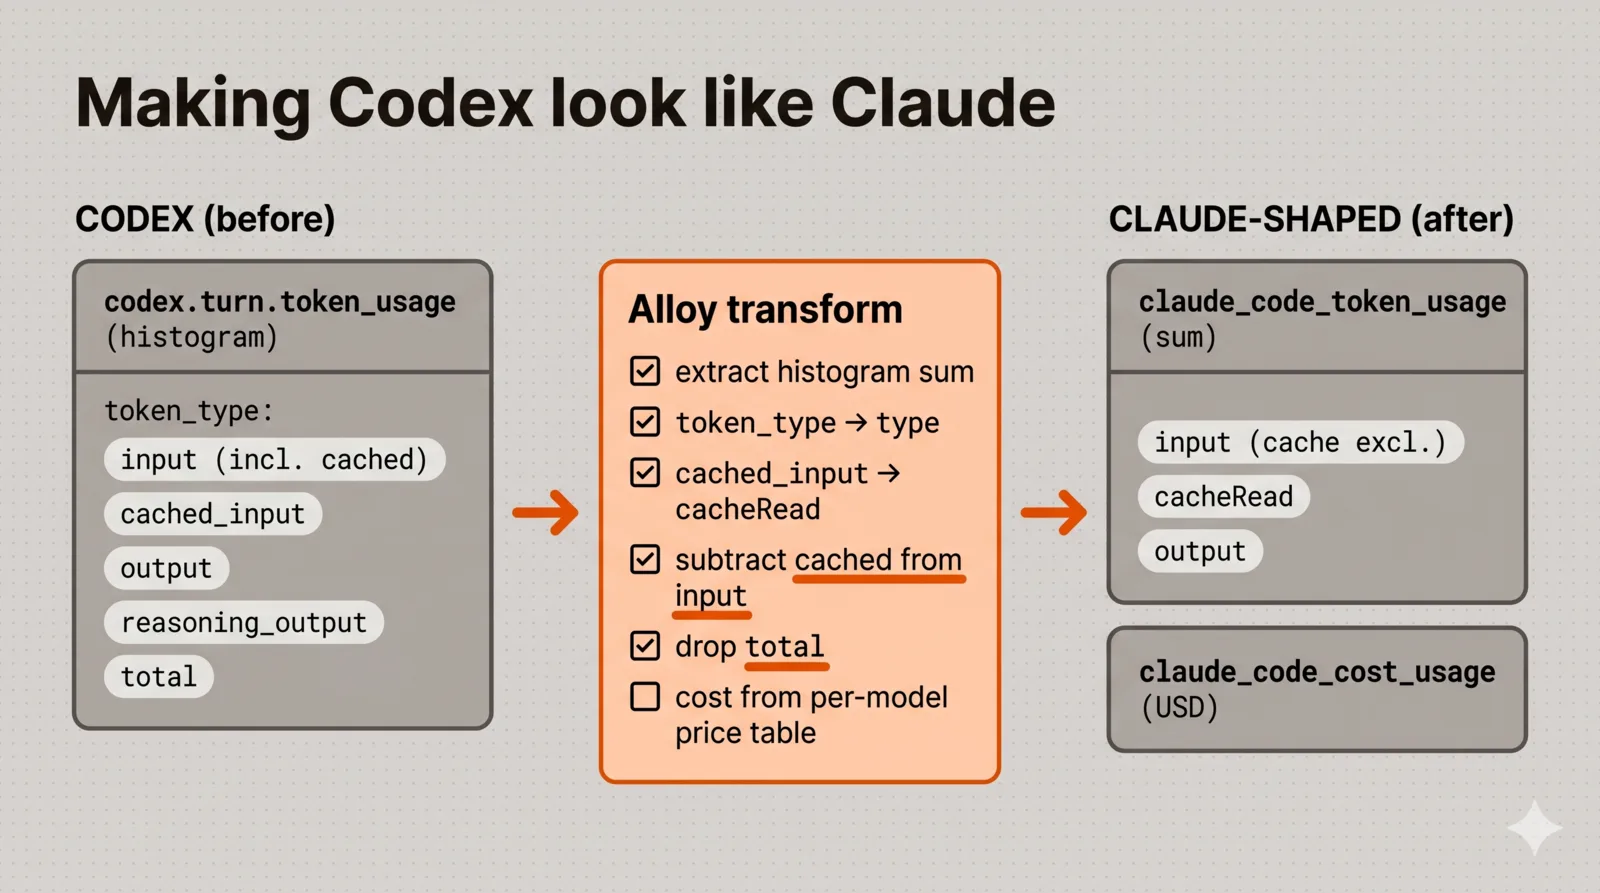
I did that normalization in Alloy with another transform processor, so the dashboard never knows the difference. The mapping has a few deliberate decisions baked in, and they’re the parts that are easy to get subtly wrong:
- Extract the histogram sum into a plain Sum metric (
extract_sum_metric), keeping the nativecodex_turn_token_usage_*histogram around for ad-hoc investigation. - Map
token_typetotype:cached_inputbecomescacheRead,outputstaysoutput. - Subtract cached input from input. This is the one that silently inflates your numbers if you miss it. Codex’s
inputcount includescached_input, while Claude reports cache reads as a separate bucket, so adding them naively double-counts every cached token. - Drop
totalfrom additive token sums (it’sinput + output, so adding it triples your real count), and treatreasoning_outputas a sub-breakdown ofoutputrather than as an extra cost line.
Cost is computed the same way, from a per-model price table (sourced from models.dev), as OTTL statements that multiply each token type by its rate. The formula is just:
cost = (input - cached) × price_input
     + cached           × price_cache_read
     + output           × price_output
A representative slice of the OTTL, one model and its three token types, looks like this; the real file repeats it per model:
`set(datapoint.value_double, datapoint.cache["tokens"] * 5.0  / 1000000.0)
   where ... and attributes["token_type"] == "input"        and attributes["model"] == "gpt-5.5"`,
`set(datapoint.value_double, datapoint.cache["tokens"] * -4.5 / 1000000.0)
   where ... and attributes["token_type"] == "cached_input" and attributes["model"] == "gpt-5.5"`,
`set(datapoint.value_double, datapoint.cache["tokens"] * 30.0 / 1000000.0)
   where ... and attributes["token_type"] == "output"       and attributes["model"] == "gpt-5.5"`,
It’s verbose and a little ugly, a price table expressed as a ladder of where clauses, but it lives in one place, server-side, and the result is that a gpt-5.5 Codex turn and a claude-opus Claude turn show up as the same claude_code_cost_usage series, queryable by the same panel. Both then run through the same deltatocumulative and native-OTLP path as everything else. This is the cost figure from the first half of the post, so the same caveat applies: it’s list prices times tokens, useful for relative intensity, not a bill.
What I’d tell myself before starting
Every layer will lie to you with a 200. The recurring failure mode of this whole project was a success code at hop N masking a silent drop at hop N+1: the bridge wrote “0 failures” while Mimir discarded on timestamp, and the client got 200 while the server returned 400 one layer in. Don’t trust the near edge; trust the metric showing up at the far edge, and when it doesn’t, go find the backend’s own discard counter (cortex_discarded_samples_total was the one that finally told the truth).
Delta-versus-cumulative is the OTLP-into-Prometheus tax. If you take OTLP metrics from a tool you don’t control and feed a Prometheus-lineage backend, expect a temporality mismatch and fix it server-side with deltatocumulative so no client config can drift. It’s the single most reusable thing I learned here.
Resource attributes aren’t labels. If you can’t group by the field you expected, it’s almost certainly sitting on target_info as a resource attribute. Promote the few you need onto datapoints and leave the unbounded ones where they are. That one mental model would have saved me the entire fourth debugging session.
Don’t co-locate an experiment with production observability. A collector rejects a bad config by not starting, and it takes everything else it carries down with it. Give a telemetry experiment its own instance until it’s boring.
Check transport support per tool before you design the ingress. HTTP and gRPC are not interchangeable across tools. One of mine was HTTP-only and another was gRPC-only in practice, so a single door was never going to cover both, and five minutes with each tool’s transport options up front would have saved me from assuming that “they both speak OTLP” meant “one endpoint works for both.”
Measure cost in the units a future bill would use. We pay flat-rate today, but the panel that prices our tokens at API rates is the one I’d least want to be missing the day metered billing arrives, or the day someone asks whether self-hosting pencils out. Measuring usage you don’t yet pay for is the cheapest hedge there is, and it costs nothing but the transform you already wrote.
All of it, the front door, the four-bug pipeline, the Codex normalization, and the dashboard, took about an hour of back-and-forth between me and a co-worker who runs Codex. 99% of the actual work was done by Claude, as it should be. The payoff is a single board that answers, honestly and with a visible asterisk on cost, the question I started with: who’s actually using these tools, how hard, and on what. For a team deciding whether the AI spend is paying off, that’s the number that was worth chasing through four false 200s to get.
Comments
Reply on Bluesky here to join the conversation.